Parallel Query Execution in CockroachDB
Optimize performance by using client-side parallel SQL queries with CockroachDB

This article provides an example of increasing large query performance by using client-side parallel query execution.
Introduction
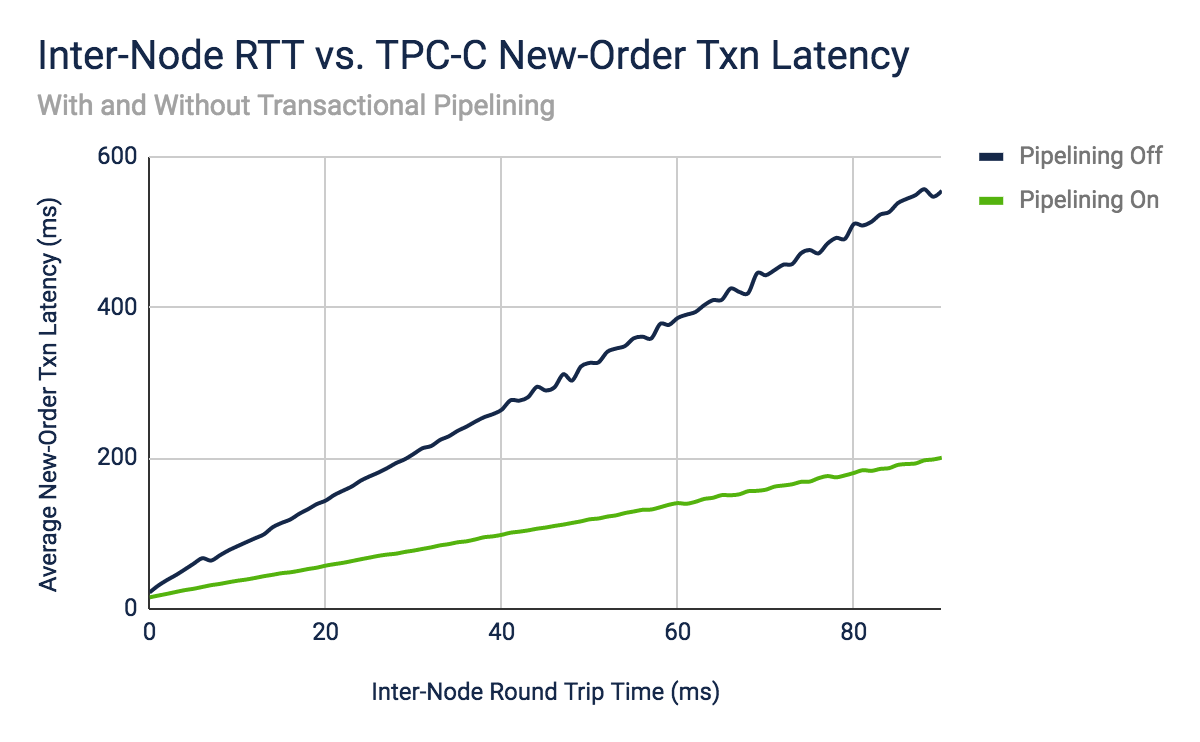
CockroachDB uses parallelism in many parts of its architecture to deliver high-scale distributed SQL execution. For example, to improve write performance, it uses a parallel atomic commit protocol designed to cut the commit latency of a transaction from two roundtrips of consensus to one. When combined with transaction pipelining, where write intents are replicated from leaseholders in parallel rather than sequentially, all waiting happens in the end at commit time, thereby drastically reducing latencies for multi-statement write transactions.
To improve read performance in multi-region high-latency deployments, the cost-based optimizer performs what's referred to as a locality-optimized search. The optimizer may begin to scan for rows in the gateway node's local region and fan out to remote regions in parallel, but only if the local region did not satisfy the query. The remote lookup (performed in parallel) result is returned to the gateway once received without having to wait for completion. This increases read performance in multi-region deployments since results can be returned from wherever they are first found, without waiting for the completion of all lookups.
Last but not least, CockroachDB also uses vectorized SQL query execution, designed to process batches of columnar data instead of just a single row at a time. In the longer term, this will also make use of vectorized CPU (SIMD) instructions.
Parallelism is well exploited in the algorithms and mechanisms that CockroachDB uses. This works well for both larger and smaller statements that don't scan large volumes of data, which is typically something you'd want to avoid doing anyway in an OLTP database.
Now to the purpose of this article, what can the client do to take this even further?
Client-side Parallelism
The CockroachDB database (and SQL for that matter) does a decent job to hide the implementation details from clients through all abstraction layers. One of the primary tasks of a SQL database is to provide the illusion to clients that they are the sole users, free to read and write any piece of information without interference from others. In reality, the environment is highly concurrent and parallelized, which in practical terms means that the database is allowed to reorder concurrent transactions as long as the result is the same as if they had executed one at a time (serially), without any concurrency. This is the definition of SERIALIZABLE transaction isolation.
A SQL database is designed to be highly capable of accepting queries from multiple application instances and threads in parallel. In a typical request-response, thread-bound execution model you get a connection from the pool, send a single or multi-statement transaction, await its completion and close the connection (recycled to the pool). While this gives a level of parallelism in terms of multiple application-level threads, it doesn't help that much for larger scans beyond what the database offers.
What if you want to take things a step further in terms of parallel execution and involve the client? For example, by first running a very large query that scans hundreds of thousands of rows to compute an aggregated sum in the database and then do the equivalent client side by decomposing the query into smaller blocks run in parallel. Let's find out if it makes any difference.
Example Use Case
Assume we have a simple product table holding an inventory column.
create table product
(
    id        uuid           not null default gen_random_uuid(),
    version   int            not null default 0,
    inventory int            not null,
    name      varchar(128)   not null,
    price     numeric(19, 2) not null,
    sku       varchar(128)   not null unique,
    country   varchar(128)   not null,

    primary key (id)
);
Next, we add a covering index on the country and insert a huge bunch of products:
CREATE INDEX ON product (country) STORING (inventory,name,price);

insert into product (inventory,name,price,sku,country)
select 10 + random() * 50,
       md5(random()::text),
       500.00 + random() * 500.00,
       gen_random_uuid()::text,
       'US'
from generate_series(1, 500000) as i;
-- Repeat insert for 9 more countries, in total 5M rows
Composed Query
Let's run a single composed query to get the total inventory sum grouped by country:
select sum(p.inventory), p.country from product p group by p.country;
Gives:
select sum(p.inventory), p.country from product p group by p.country;
    sum    | country
-----------+----------
  17251976 | BE
  17253042 | DE
  17234287 | DK
  17253539 | ES
  17229425 | FI
  17250751 | FR
  17247093 | NO
  17257296 | SE
  17237964 | UK
  17261461 | US
(10 rows)


Time: 4.083s total (execution 4.083s / network 0.000s)
This query still runs fairly fast for a total row count of 5M. Let's look a the explain plan to see that we are scanning the entire table:
explain analyze select sum(p.inventory), p.country from product p group by p.country;
                                                            info
-----------------------------------------------------------------------------------------------------------------------------
  planning time: 421µs
  execution time: 4.1s
  distribution: full
  vectorized: true
  rows read from KV: 5,000,000 (466 MiB, 47 gRPC calls)
  cumulative time spent in KV: 3.8s
  maximum memory usage: 10 MiB
  network usage: 0 B (0 messages)
  regions: europe-west1

  • group (streaming)
  │ nodes: n1
  │ regions: europe-west1
  │ actual row count: 10
  │ estimated row count: 10
  │ group by: country
  │ ordered: +country
  │
  └── • scan
        nodes: n1
        regions: europe-west1
        actual row count: 5,000,000
        KV time: 3.8s
        KV contention time: 0µs
        KV rows read: 5,000,000
        KV bytes read: 466 MiB
        KV gRPC calls: 47
        estimated max memory allocated: 10 MiB
        estimated row count: 7,036,818 (100% of the table; stats collected 5 days ago; using stats forecast for 5 days ago)
        table: product@product_country_idx
        spans: FULL SCAN
(31 rows)


Time: 4.091s total (execution 4.090s / network 0.000s)
Decomposed Parallel Queries
Let's decompose the single query into multiple ones and run them in parallel, then combine the results in the end. We refactor the query by removing the GROUP BY and filtering on the indexed country column instead. Effectively the GROUP BY operator is moved client side.
Example of a single country query:
select sum(p1_0.inventory) from product p1_0 where p1_0.country='US';
    sum
------------
  17261461
(1 row)

Time: 231ms total (execution 231ms / network 0ms)
Let's also check the execution plan:
explain analyze select sum(p1_0.inventory) from product p1_0 where p1_0.country='US';
                                                           info
---------------------------------------------------------------------------------------------------------------------------
  planning time: 535µs
  execution time: 248ms
  distribution: full
  vectorized: true
  rows read from KV: 500,000 (47 MiB, 5 gRPC calls)
  cumulative time spent in KV: 225ms
  maximum memory usage: 10 MiB
  network usage: 0 B (0 messages)
  regions: europe-west1

  • group (scalar)
  │ nodes: n1
  │ regions: europe-west1
  │ actual row count: 1
  │ estimated row count: 1
  │
  └── • scan
        nodes: n1
        regions: europe-west1
        actual row count: 500,000
        KV time: 225ms
        KV contention time: 0µs
        KV rows read: 500,000
        KV bytes read: 47 MiB
        KV gRPC calls: 5
        estimated max memory allocated: 10 MiB
        estimated row count: 696,645 (9.9% of the table; stats collected 5 days ago; using stats forecast for 5 days ago)
        table: product@product_country_idx
        spans: [/'US' - /'US']
(29 rows)


Time: 249ms total (execution 249ms / network 0ms)
The estimated row count is about 10% of the table which sounds about right since we inserted 500K rows per country.
Now we apply a parallel fork and join operation at the client side. This means we fire ten concurrent threads with the individual queries and then await completion before proceeding. After that, the results are joined together.
For this example, we'll use Spring Data and a JPA query:
@Query("select sum(p.inventory) from Product p where p.country = :country")
Integer sumInventory(@Param("country") String country);
First queue up the workers, one for each country:
List<Callable<Pair<String, Integer>>> tasks = new ArrayList<>();
  StringUtils.commaDelimitedListToSet("SE,UK,DK,NO,ES,US,FI,FR,BE,DE").forEach(country ->
  tasks.add(() -> Pair.of(country, productRepository.sumInventory(country))));
Next, we unleash the workers to run in parallel while blocking until completion (or cancellation by timeout):
ConcurrencyUtils.runConcurrentlyAndWait(tasks, 10, TimeUnit.MINUTES, sums::add);
This utility method makes use of Java's CompletableFuture was introduced way back in Java 8. It's like a Swiss army knife for asynchronous computations using parallel decomposition constructs. Tasks are decomposed into steps that can be forked and joined in different stages to a final result. It's a very elegantly designed API.
In this example, we are just using a small subset of it to run our query tasks in parallel and join the results. It also adds cancellation, in case queries would go rogue and run for too long. Cancellation is not a natural part of CompletableFuture so there's a small trick in there to add that.
It's also using a bounded thread pool which means that no matter how many tasks are queued it will only run a limited number of concurrent threads by adding backpressure on the client code queuing up tasks. This is more lenient on thread scheduling since the client will be blocking anyway.
ScheduledExecutorService cancellationService
        = Executors.newSingleThreadScheduledExecutor();

ExecutorService executor = boundedThreadPool();

List<CompletableFuture<Void>> allFutures = new ArrayList<>();

final Instant expiryTime = Instant.now().plus(timeout, timeUnit.toChronoUnit());

tasks.forEach(callable -> {
    allFutures.add(CompletableFuture.supplyAsync(() -> {
                if (Instant.now().isAfter(expiryTime)) {
                    logger.warn("Task scheduled after expiration time: " + expiryTime);
                    return null;
                }
                Future<V> future = executor.submit(callable);
                long cancellationTime = Duration.between(Instant.now(), expiryTime).toMillis();
                cancellationService.schedule(() -> future.cancel(true), cancellationTime, TimeUnit.MILLISECONDS);
                try {
                    return future.get();
                } catch (InterruptedException e) {
                    Thread.currentThread().interrupt();
                    throw new IllegalStateException(e);
                } catch (ExecutionException e) {
                    throw new IllegalStateException(e.getCause());
                }
            }, executor)
            .thenAccept(completionFunction)
            .exceptionally(throwableFunction)
    );
});

CompletableFuture.allOf(
        allFutures.toArray(new CompletableFuture[]{})).join();

executor.shutdownNow();
cancellationService.shutdownNow();
Once all the query sums are gathered we simply add them up client side using a stream API aggregator:
sums.stream().mapToInt(Pair::getSecond).sum()
OK, the result then? Here's the log output:
09:21:53.253  INFO [i.r.s.p.ParallelApplication$$SpringCGLIB$$0] Inventory sum for UK is 17237964
09:21:53.253  INFO [i.r.s.p.ParallelApplication$$SpringCGLIB$$0] Inventory sum for US is 17261461
09:21:53.253  INFO [i.r.s.p.ParallelApplication$$SpringCGLIB$$0] Inventory sum for DK is 17234287
09:21:53.253  INFO [i.r.s.p.ParallelApplication$$SpringCGLIB$$0] Inventory sum for SE is 17257296
09:21:53.253  INFO [i.r.s.p.ParallelApplication$$SpringCGLIB$$0] Inventory sum for ES is 17253539
09:21:53.253  INFO [i.r.s.p.ParallelApplication$$SpringCGLIB$$0] Inventory sum for NO is 17247093
09:21:53.253  INFO [i.r.s.p.ParallelApplication$$SpringCGLIB$$0] Inventory sum for FR is 17250751
09:21:53.253  INFO [i.r.s.p.ParallelApplication$$SpringCGLIB$$0] Inventory sum for DE is 17253042
09:21:53.253  INFO [i.r.s.p.ParallelApplication$$SpringCGLIB$$0] Inventory sum for FI is 17229425
09:21:53.253  INFO [i.r.s.p.ParallelApplication$$SpringCGLIB$$0] Inventory sum for BE is 17251976
09:21:53.254  INFO [i.r.s.p.ParallelApplication$$SpringCGLIB$$0] Total inventory sum is 172476834
09:21:53.254  INFO [i.r.s.p.ParallelApplication$$SpringCGLIB$$0] Verified inventory sum is 172476834
09:21:53.254  INFO [i.r.s.p.ParallelApplication$$SpringCGLIB$$0] Parallel execution time: PT1.1578745S
09:21:53.254  INFO [i.r.s.p.ParallelApplication$$SpringCGLIB$$0] Serial execution time: PT2.9943538S
09:21:53.254  INFO [i.r.s.p.ParallelApplication$$SpringCGLIB$$0] Execution time diff: 259%
In this simple example, we can notice a 260% performance improvement by decomposing the query and running these independently.
Conclusion
This article explains how CockroachDB uses parallelism to improve read and write performance, and how client-side parallel query execution can be used to further increase large query performance. An example use case is provided to illustrate how this works, using Spring Data and a JPA query to run a parallel fork and join operation at the client side with a bounded thread pool and a cancellation service.
The source code for the article is available on GitHub.


